
Debug Language Server
Trace language server startup, transport, configuration, environment, and protocol failures with output channels, logs, and reproducible launch details.
coc.nvim project documentation · Content sources and maintainers
Edit this pageContents
Check out server stats
Use the :CocList services command to open the services list. Each service shows its id, state, and filetypes.
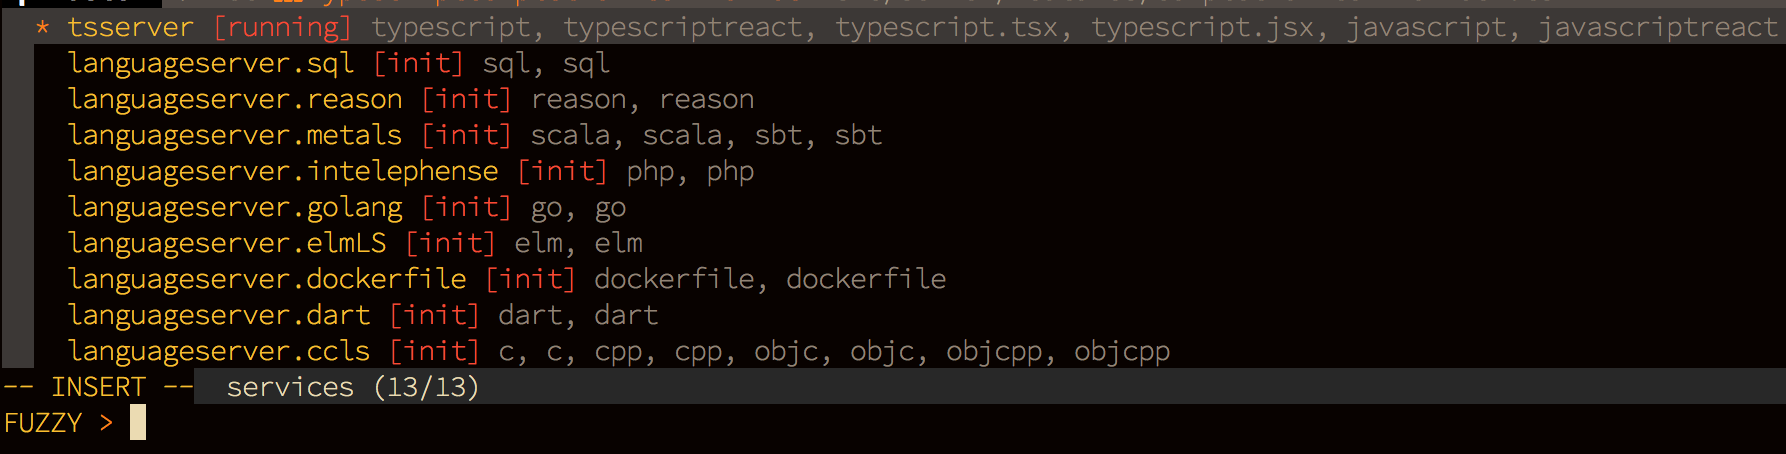
If a service id starts with languageserver, it comes from the languageserver configuration in coc-settings.json; otherwise, it comes from a coc.nvim extension.
A service does not start unless it matches a buffer's filetype. Use :CocCommand document.echoFiletype to get the filetype detected by coc.nvim for the current buffer.
Using output channel
As in VS Code, each language server has its own output channel. Open the output channel with:
| 1 | :CocCommand workspace.showOutput |
To log all LSP communication in an output channel, set trace.server to verbose in your coc-settings.json.
For example, to log all LSP communication from tsserver in the coc-tsserver extension, use:
| 1 | "tsserver.trace.server": "verbose", |
To log all LSP communication from a user-defined language server, add a trace.server entry to your language server configuration:
| 1 | "languageserver":{ |
| 2 | "ccls": { |
| 3 | "command": "ccls", |
| 4 | "filetypes": ["c", "cpp", "objc", "objcpp"], |
| 5 | "trace.server": "verbose", |
| 6 | "initializationOptions": { |
| 7 | "cacheDirectory": "/tmp/ccls" |
| 8 | } |
| 9 | } |
| 10 | } |
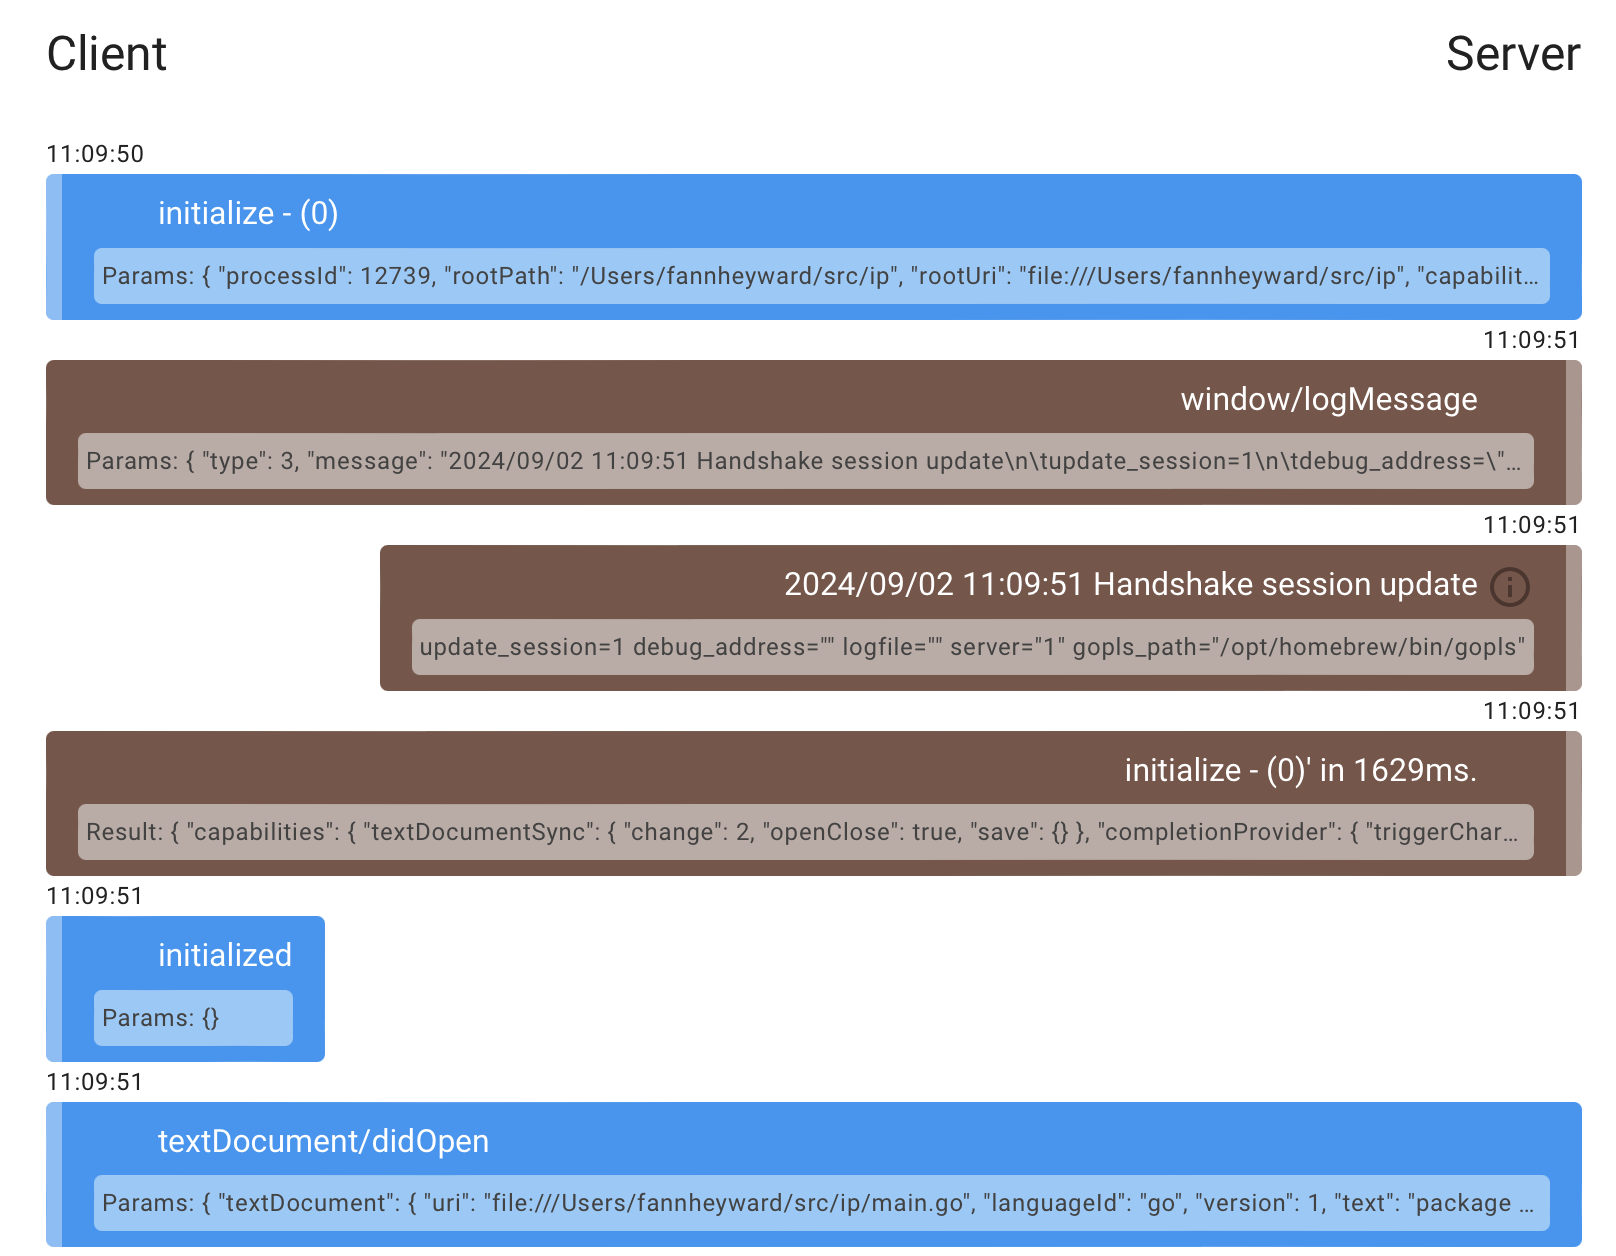
LSP logs can be difficult to read. Use LSP Log Parser to parse, view, and filter them:
Using Chrome Developer Tools
You can use Google Chrome to debug a language server that communicates over Node.js IPC. The server must be implemented in JavaScript, like the CSS language server from coc-css.
First, add execArgv to the language server settings:
| 1 | "css.execArgv": ["--nolazy", "--inspect-brk=6045"] |
After the css service starts, open the URL chrome://inspect in Chrome.
Select Discover network targets and add the address to Target discovery settings. The debugging target will then appear.
Note: Install coc-json for automatic JSON completion.