
Debug coc.nvim
Diagnose coc.nvim startup, extension, RPC, and editor-integration problems with logs, version checks, minimal reproduction steps, and safe evidence collection.
This page contains tips for debugging coc.nvim. If you have issues with a specific language server, see /docs/debug-language-server first.
Build source code
After cloning the repo, make sure you're using the master branch of coc.nvim, then install dependencies
and build the source code:
| 1 | npm ci |
The JavaScript bundle will exist in the build folder.
To rebuild the source code after making changes, run:
| 1 | npm run watch |
in your project root; this uses rolldown to compile the source code into a single JavaScript bundle.
After each compile, restart the coc.nvim service with :CocRestart to use the new JavaScript code.
Restarting Vim is needed after you've made changes to coc.nvim's plugin code.
Enable source map support
To create a source map of the JavaScript bundle and compile the source code, run:
| 1 | NODE_ENV=development npm run build |
To enable source maps in error stack traces, install source-map-support:
| 1 | yarn global add source-map-support |
Then use a configuration like:
| 1 | " Use the `yarn global dir` command in your terminal to check the yarn global directory. |
| 2 | let g:coc_node_args = ['-r', expand('~/.config/yarn/global/node_modules/source-map-support/register')] |
in your vimrc; this makes tracing errors much easier.
Get results from console
Warning: avoid using process.stdout, process.stdin, and related console methods, because coc.nvim has to use stdio for communication between it and (neo)vim.
You can use console.error to write a string message:
| 1 | console.error('my error') |
The message will be echoed in Vim. However, this method is quite limited.
Use the logger module
Use :CocOpenLog to open the log file.
Import the logger module for logging:
| 1 | const { createLogger } = require('./logger') |
| 2 | const logger = createLogger('workspace') |
Use the logger to inspect any variable, for example:
| 1 | logger.debug('variable:', variable) |
For coc.nvim extensions, use the logger object (Logger) from ExtensionContext. For example:
| 1 | exports.activate = async (context) => { |
| 2 | let { logger } = context; |
| 3 | logger.info(`Extension from ${context.extensionPath}`) |
| 4 | } |
If you use console.log in an extension, the output will be appended to coc.nvim's log.
The default log level is info, so debug or trace messages won't be shown in :CocOpenLog.
To change the log level, configure the NVIM_COC_LOG_LEVEL environment variable. See
:h :CocOpenLog for details.
Inspect communication between vim and coc.nvim
Enable the client log by:
| 1 | let g:node_client_debug = 1 |
| 2 | let $NODE_CLIENT_LOG_FILE = '/path/to/logfile' |
in your vimrc. Then open $NODE_CLIENT_LOG_FILE in another terminal, or use :call coc#client#open_log()
to open the log from the current vim session.
Use a Node.js debugger
Add:
| 1 | let g:coc_node_args = ['--nolazy', '--inspect=6045'] |
to your .vimrc
After restarting coc, you will get a message like this:
| 1 | [vim-node-coc]: Debugger listening on ws://127.0.0.1:6045/cd7eea09-c79f-4100-b4a0-bfbb43e94f48 |
| 2 | For help, see: https://nodejs.org/en/docs/inspector |
This means the debugger protocol has started.
Open chrome://inspect in Chrome, make sure Discover network targets is checked, and then click the Configure... button:

Then add 127.0.0.1:6045 to the Target discovery settings.
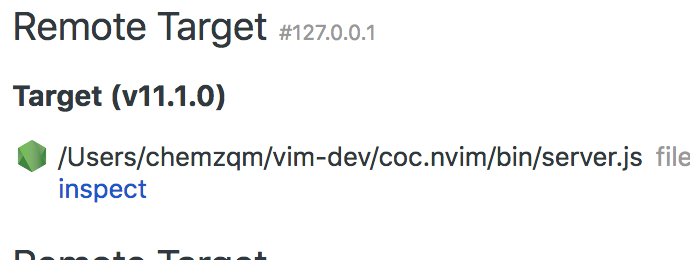
Check the remote target section, then click inspect for the Node.js target:
For more details about debugging, check out Node.js debugging guide.